Market
Shall We Repeal the Laws of Economics – Part III
Market / Real Estate
Real Estate Recovery: Resilience Amid Volatility
KEY POINTS
- Private real estate appears attractive and likely to maintain its recent momentum, despite recent market volatility
- Normalizing deal flow, improving valuations and stabilizing cap rates support this momentum
- Historically, real estate has exhibited resilience characteristics including low correlations, steady income and inflation-hedging properties that support an attractive outlook
Three Factors Are Driving Momentum
Private real estate continues to gain momentum, a trend that began in 2024, despite persistent equity market volatility. In fact, it reinforces a historical trend: Private real estate historically has exhibited significantly less volatility than public equity markets during market downturns (see below).
Image
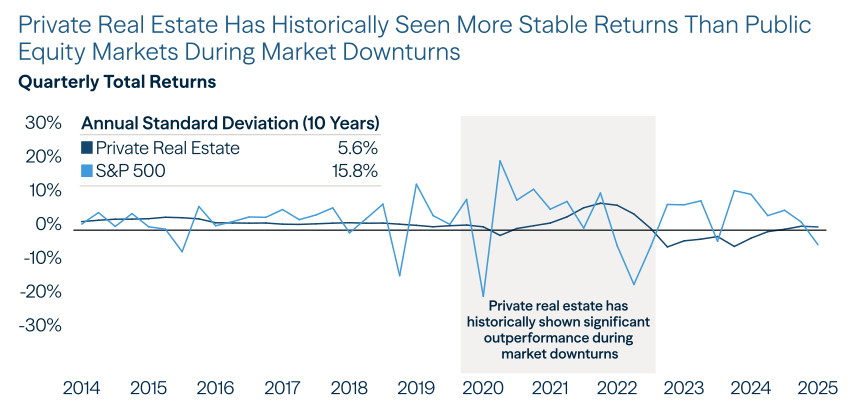
Past performance is not a reliable indicator of future results. Historical data are provided for illustrative purposes only, and outcomes may vary. Indexes are unmanaged and not available for direct investment. Represents quarterly returns for each index, and 10-year, annualized standard deviations. Private Real Estate represented by the NCREIF Fund Index–Open End Diversified Core Equity (NFI-ODCE). U.S. Equities represented by S&P 500 Index.
Source: Bloomberg, National Council of Real Estate Investment Fiduciaries, S&P. As of March 31, 2025.
Three factors are driving private real estate’s momentum:
1. Deal flow is normalizing. In 2025, total transaction volume rose to $354 billion—the highest level since 2022. This is a sign of investor confidence returning to the commercial real estate market (see below).
Image
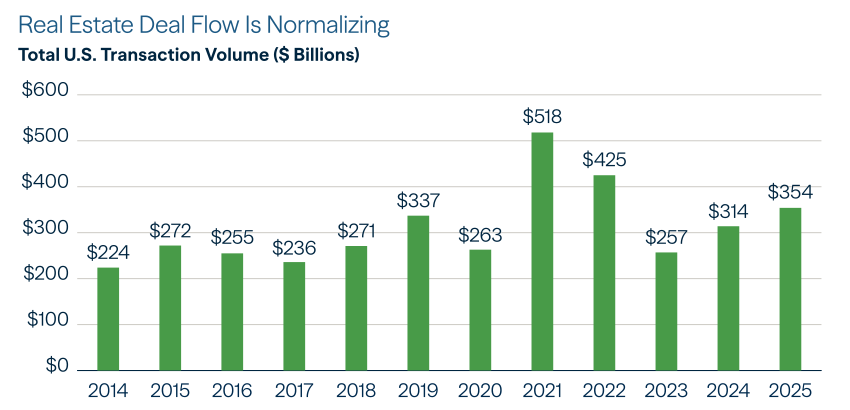
Source: Green Street, as of March 2026.
2. Valuations have stabilized. Renewed deal activity has contributed to stable valuations, which continued to rise in 2025, and were up 7.4% from a trough in late 2023 (see below).
Image
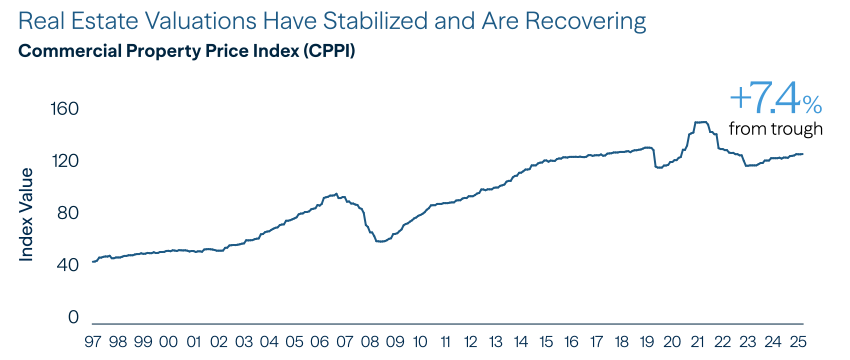
Source: Green Street, as of March 2026.
3. Cap rates have stabilized. Cap rates have stabilized as well, influenced by the recent drop in interest rates (see below). If rates continue to move lower, that should potentially push cap rates to lower levels, and in turn, lower implied risk. In the meantime, there are still attractive opportunities to acquire properties that have stable current income profiles at discounted valuations.
Image
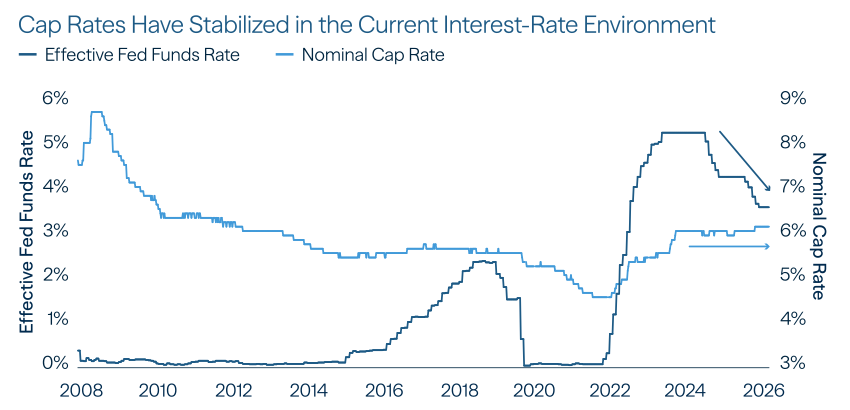
Source: Federal Reserve Bank of St. Louis, Green Street, as of March 2026.
Outlook for the Rest of the Year
We believe that real estate will continue its momentum and perform well this year, despite the headwinds created by greater market volatility. Private real estate has resilient characteristics that potentially can provide a cushion during turbulent markets. These include:
- Lower correlations. Private real estate historically has shown lower correlations with public equity markets, which offers diversification benefits and helps result in lower volatility than the stock market.
- Income-driven returns. Even if capital appreciation slows, private real estate has historically generated consistent cash flows, particularly in sectors like industrial or residential real estate, which tend to be less sensitive to economic downturns.
- Inflation hedge. Real estate values and rents often rise with inflation, offering protection against rising costs.
- Value reset opportunities. Although valuations are improving, they are still below recent peaks. In addition, replacement costs for real estate remain elevated due to higher building costs. Thus, we still see attractive investment opportunities with strong underlying sector fundamentals.
- Long-term focus. While short-term market noise may give investors pause, the long-term value opportunity of real estate can offer stability for the long run.
The Bottom Line
Private real estate’s historical resilience during periods of market turmoil underscores why many investors are seeking to increase their allocation to the asset class. Stable, long-term, value-add real estate investment strategies are attractive for helping investors meet their investing goals by strengthening their portfolios over the long term—and these strategies can provide a cushion during shorter-term volatility.
A WORD ABOUT RISK
As an asset class, private credit comprises a large variety of different debt instruments. While each has its own risk and return profile, private credit assets generally have increased risk of default, due to their typical opportunistic focus on companies with limited funding options, in comparison with their public equivalents. Because private credit usually involves lending to below-investment-grade or non-rated issuers, yield on private credit assets is increased in return for taking on increased risk.
Investments in real estate-related instruments may be affected by economic, legal or environmental factors that affect property values, rents or occupancies of real estate.
Infrastructure companies may be subject to a variety of factors that may adversely affect their business, including high interest costs, high leverage, regulation costs, economic slowdowns, surplus capacity, increased competition, lack of fuel availability and energy conservation policies.
Alternative investments often are speculative and include a high degree of risk. Investors could lose all or a substantial amount of their investment. High-yield bonds are subject to interest-rate risk. When interest rates rise, bond prices fall; generally, the longer a bond’s maturity, the more sensitive it is to this risk. Yields are subject to change with economic conditions. Yield is only one factor that should be considered when making an investment decision.
The information in this publication is not and is not intended as investment advice, an indication of trading intent or holdings, or a prediction of investment performance. Diversification does not guarantee a profit or protect against loss. The views and information expressed herein are subject to change at any time. Brookfield disclaims any responsibility to update such views and/or information. This information is deemed to be from reliable sources; however, Brookfield does not warrant its completeness or accuracy.
The opinions expressed herein are the current opinions of Brookfield, including its subsidiaries and affiliates, and are subject to change without notice. Brookfield, including its subsidiaries and affiliates, assumes no responsibility to update such information or to notify clients of any changes. Any outlooks, forecasts or portfolio weightings presented herein are as of the date appearing on this material only and are also subject to change without notice. Past performance is not indicative of future performance, and the value of investments and the income derived from those investments can fluctuate.
FORWARD-LOOKING STATEMENTS
The information herein contains, includes or is based on forward-looking statements within the meaning of the federal securities laws, specifically Section 21E of the Securities Exchange Act of 1934, as amended, and Canadian securities laws. Forward-looking statements include all statements, other than statements of historical fact, that address future activities, events or developments, including, without limitation, business or investment strategy or measures to implement strategy, competitive strengths, goals, expansion and growth of our business, plans, prospects and references to our future success. You can identify these statements by the fact that they do not relate strictly to historical or current facts.
Words such as “anticipate,” “estimate,” “expect,” “project,” “intend,” “plan,” “believe” and other similar words are intended to identify these forward-looking statements. Forward-looking statements can be affected by inaccurate assumptions or by known or unknown risks and uncertainties. Many such factors will be important in determining our actual future results or outcomes. Consequently, no forward-looking statement can be guaranteed.
Our actual results or outcomes may vary materially. Given these uncertainties, you should not place undue reliance on these forward-looking statements. They are not intended to provide an overview of the terms applicable to any products sponsored by Brookfield Corporation and its affiliates (together, “Brookfield”). Information and views are subject to change without notice. Some of the information provided herein has been prepared based on Brookfield’s internal research, and certain information is based on various assumptions made by Brookfield, any of which may prove to be incorrect. Brookfield may not have verified (and disclaims any obligation to verify) the accuracy or completeness of any information included herein, including information that has been provided by third parties, and you cannot rely on Brookfield as having verified any of the information. The information provided herein reflects Brookfield’s perspectives and beliefs as of the date of this commentary.
INDEX PROVIDER DISCLAIMER
The quoted indexes within this publication are unmanaged and cannot be purchased directly by investors. Index performance is shown for illustrative purposes only and does not predict or depict the performance of any investment. There may be material factors relevant to any such comparison, such as differences in volatility and also regulatory and legal restrictions between the indexes shown and any investment in a Brookfield strategy, composite or fund. Brookfield obtained all index data from third-party index sponsors and believes the data to be accurate; however, Brookfield makes no representation regarding its accuracy.
Brookfield does not own or participate in the construction or day-to-day management of the indexes referenced in this document. The index information provided is for your information only and does not imply or predict that a Brookfield product will achieve similar results. This information is subject to change without notice. The indexes referenced in this document do not reflect any fees, expenses, sales charges or taxes. It is not possible to invest directly in an index. The index sponsors permit use of their indexes and related data on an “as is” basis, make no warranties regarding the same, do not guarantee the suitability, quality, accuracy, timeliness and/or completeness of their index or any data included in, related to or derived from it, and assume no liability in connection with the use of the foregoing. The index sponsors have no liability for any direct, indirect, special, incidental, punitive, consequential or other damages (including loss of profits). The index sponsors do not sponsor, endorse or recommend Brookfield or any of its products or services. Unless otherwise noted, all indexes are total-return indexes.
KEY TERMS AND INDEX DEFINITIONS
Bloomberg Global Aggregate Index is a market-capitalization-weighted index comprising globally traded investment-grade bonds. The index includes government securities, mortgage-backed securities, asset-backed securities and corporate securities to simulate the universe of bonds in the market. The maturities of the bonds in the index are more than one year.
The Economic Policy Uncertainty Index for the United States reflects scaled frequency counts of articles in 10 leading newspapers (USA Today, the Miami Herald, the Chicago Tribune, the Washington Post, the Los Angeles Times, the Boston Globe, the San Francisco Chronicle, the Dallas Morning News, the Houston Chronicle and the Wall Street Journal). The construction of the modern portion of the index (1985–present) was based on monthly searches of each paper for terms related to economic policy uncertainty. Terms include “uncertainty” or “uncertain,” “economic” or “economy,” and one or more of the following: “Congress,” “legislation,” “White House,” “regulation,” “Federal Reserve,” or “deficit.”
Green Street Commercial Property Price Index (CPPI) is a time-series index published by Green Street, which tracks the value of U.S. commercial real estate properties. The index is based on transaction prices and appraisals of institutional-quality properties across major sectors, including office, industrial, retail and multifamily. It is widely used as a benchmark for changes in commercial property values over time.
Lincoln Senior Debt Index is a quarterly index that tracks the fair market value of 1,600 middle market, direct lending credit investments every quarter across approximately 175+ fund clients in the U.S. and Europe.
MSCI World Index is a free-float-adjusted market-capitalization-weighted index that is designed to measure the equity market performance of developed markets.
NFI-ODCE Index is an index of the investment returns (gross of fees) of the largest private real estate funds pursuing a core investment strategy that is typically characterized by low risk, low leverage (less than 40%), and stable properties diversified across the U.S.
Preqin Infrastructure Index captures in an index the return earned by investors on average in their private infrastructure portfolios, based on the actual amount of money invested in private capital partnerships. Each data point is individually calculated from the pool of closed-end funds for which comprehensive performance data is held, as of both the start and end of the quarter.
Preqin Private Equity Index captures in an index the return earned by investors on average in their private equity portfolios, based on the actual amount of money invested in private capital partnerships. Each data point is individually calculated from the pool of closed-end funds for which comprehensive performance data is held, as of both the start and end of the quarter.
Preqin Real Estate Index captures in an index the return earned by investors on average in their private real estate portfolios, based on the actual amount of money invested in private capital partnerships. Each data point is individually calculated from the pool of closed-end funds for which comprehensive performance data is held, as of both the start and end of the quarter.
S&P 500 Index is a market-cap-weighted equity index of 500 widely held, large-capitalization U.S. companies.
© 2026 Brookfield
ID BPW9343315
