Market
Memos From Howard Marks: What’s Going on in Private Credit?Market / General
Alts Quarterly: Headwinds and Tailwinds: Navigating What’s Ahead
Investing is always a question of balancing risk and reward—even when the former seems to be overlooked or underrated. Read our Q3 Alts Quarterly to learn more.
Introduction
Risk assets continued to surge in the second quarter. Equities and other risk assets continued to rally in the second quarter, resulting in the best quarter since 2000 for both the S&P 500 and the Nasdaq.1 Equities enjoyed a number of tailwinds, in particular increased profits, exuberant sentiment and a dip in oil prices following the ceasefire with Iran.
A broad-based rally. While the equity rally (and the strong profits driving it) was largely portrayed as a technology phenomenon—in particular, artificial intelligence (AI)—it was also driven by other sectors, including financials and industrials.2 Emerging markets outperformed the U.S., while developed international stocks enjoyed another strong quarter.
Potential headwinds persist. While it seemed at times like the rally was unstoppable, as any sell-offs were met with quick rebounds, equities still face some potential headwinds. Valuations are still expensive by most historical standards, geopolitical tensions continue to simmer and the economic outlook (particularly with respect to inflation) is murky.
Tailwinds vs. headwinds. A big question hanging over markets today is: How long can these tailwinds continue to overcome the lingering headwinds? Some other questions market participants are asking themselves today are: Do potential gains from the AI revolution matter more than the valuations of companies at the forefront of that revolution? Can the consumer spending tailwind beat the inflation headwind?
Investing is always a matter of balancing risk and reward—headwinds vs. tailwinds—even when the former are often overlooked or underrated. Indeed, for other asset classes than U.S. public equities, the current market story is a more nuanced tale of assessing those two forces. And understanding how to balance them is particularly important at this point in the market cycle. Diversification is as essential as ever.3
Against this backdrop, in this issue of the Alts Quarterly we will explore the headwinds and tailwinds investors are facing with respect to the four main alternative investment asset classes: private real estate, infrastructure, private equity and private credit. A recurring theme we find is that what seems like a headwind now may become a tailwind in the future.
Private real estate. We believe we may be in the early stages of a real estate recovery, one that will offer strong investment opportunities for the next several years. In this issue of the Alts Quarterly we explore the five factors that support real estate investing, and the headwinds that may become tailwinds.
Infrastructure. The infrastructure investing landscape is shifting, shaped by a combination of tailwinds—including strong demand for power—and headwinds such as regulatory obstacles, which limit the building of facilities to meet that demand. We believe that investors with sufficient capital, sourcing advantages and operating expertise may be better positioned to navigate this environment.
Private equity. While private equity activity is increasing, the recovery remains selective. A large backlog of unsold companies is putting pressure on transactions, while the AI boom and advanced manufacturing are expanding the opportunity set in certain areas of the physical economy. Meanwhile, deal activity is improving, yet the need for selectivity remains.
Private credit. We take a look at private credit’s recent struggles and explain why we believe they may signal a healthy reset rather than a broken market. Slower deal activity may restore lender discipline. The repricing of loans may improve their forward economics. And while borrower stress and liquidity pressure may lead to greater manager dispersion, it may also create secondary opportunities along with the potential for a broader private credit allocation.
Our quarterly Alts Market Dashboard compiles data, market and investing insights we find interesting from across the alternatives investing universe. Notable numbers include:
- 29%: Global private real estate fundraising rose 29% quarter over quarter (QoQ) to $34.3 billion in Q2 2026, supporting signs of an early-stage recovery.4
- 12.7%: Infrastructure deal count increased 12.7% QoQ, with renewable energy transactions accounting for most of the activity, demonstrating the growing demand for power and energy systems.5
- $100B: Private equity secondary transaction volume exceeded $100 billion in the first half of 2026, reflecting strong market activity alongside greater manager selectivity.6
A New Chapter for Real Estate
Key Points
- We believe we may be in the early stages of a real estate recovery.
- A range of factors are supporting this recovery, from strong demand to supply constraints to a positive lending environment.
- We believe that this may be an opportune time to invest in private real estate, and that the recovery may offer strong investment opportunities and potential benefits for the next several years.
Backed by Gains: A Real Estate Recovery
We believe we are in the early stages of a real estate recovery, one that offers strong investment opportunities for the next several years. Real estate is arguably seeing more tailwinds than headwinds currently, and the current market environment may present opportunities for long-term investors.
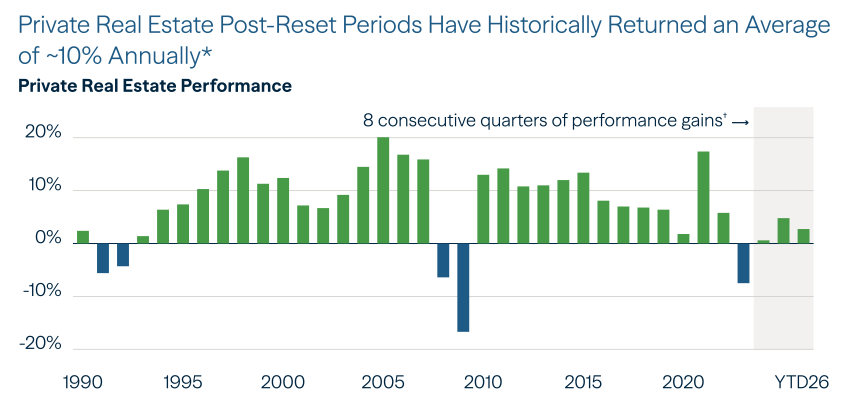
Real estate values recently underwent a significant correction across many sectors. Now the sector is recovering, and that recovery is accelerating. We have seen eight straight quarters of performance gains (see below), improving transaction volumes and more constructive financing markets. The first half of 2026 saw 4x more valuation improvement than in all of 2024.
Image
Past performance is not indicative of future results. There is no guarantee that investment objectives can be achieved.
An investor cannot invest in an index. While current conditions may present opportunities, real estate markets remain cyclical and subject to uncertainty, and outcomes will vary based on market conditions and investment selection.
* Based on certain market observations. The periods referenced are based on selected historical downturns and may not be representative of all market cycles. Private real estate represented by NCREIF Property Index and NFI-ODCE (U.S. indexes) as of June 30, 2026. YTD26 is year to date as of June 30, 2026.
† Represents annual return in the five years post-downturn.
Source: National Council of Real Estate Investment Fiduciaries (NCREIF). As of June 2026.
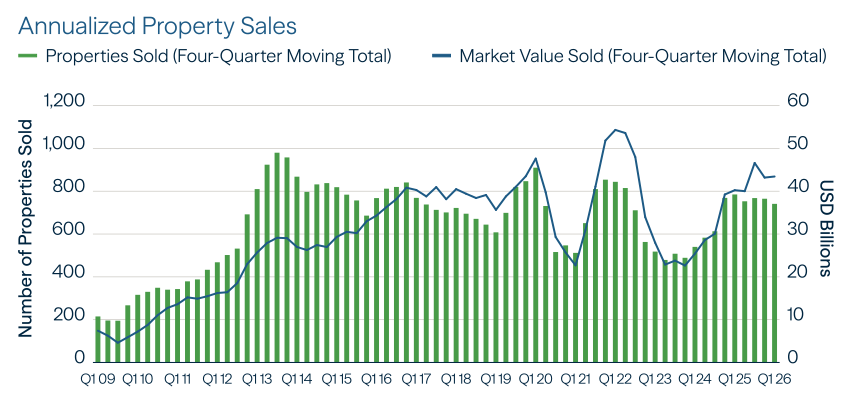
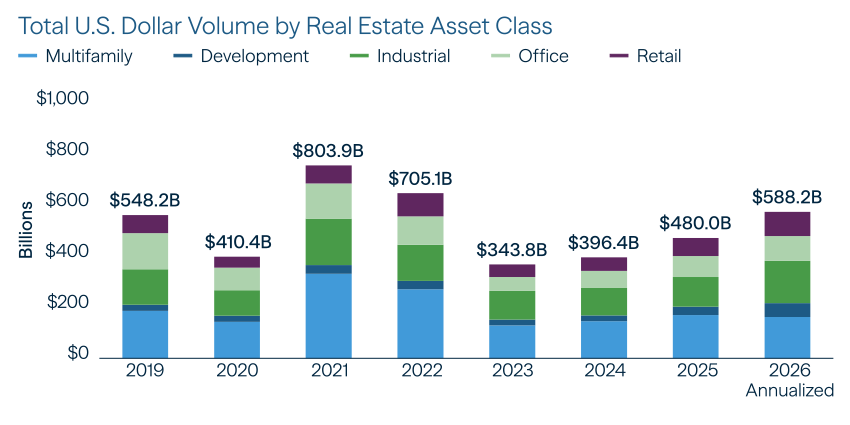
The U.S. real estate sales market recorded 3,426 transactions totaling $62.9 billion through the end of Q1 2026—a 7.71% increase in transactions and an 18% increase in dollar volume compared with Q1 2025.7 This sales volume is the clearest sign yet that the market has thawed (see below).
Image
Past performance is not indicative of future results.
Source: NCREIF. As of March 31, 2026.
Image
Past performance is not indicative of future results.
Source: Avison Young. As of March 31, 2026.
In past cycles after recovering, real estate has historically delivered strong performance for several years.
This suggests that we may still be in the early stages of a recovery, which can offer strong investment opportunities over time.
Five Factors That Support the Real Estate Opportunity
We believe there are five key factors that support the real estate opportunity:
- Strong secular demand drivers. The real estate market is supported by strong demand rooted in long-term themes such as property investments—e.g., to support the growth of AI, modernize logistics real estate and address ongoing housing shortages.
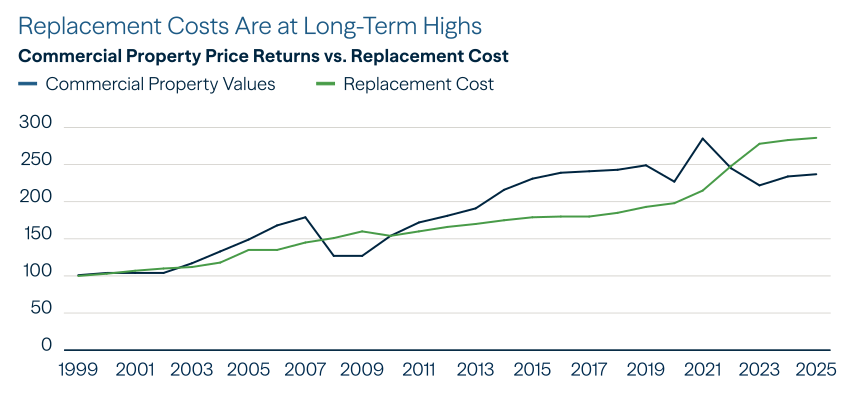
- Constrained new supply. Despite strong demand, construction starts are lagging across the globe, there is little new supply, and replacement costs are at historical highs (see below). Unlike past real estate recoveries that saw aggressive development, higher construction costs and elevated financing costs have significantly reduced development activity. All of this suggests that property values will remain elevated, benefiting investors.
Image
Past performance is not indicative of future results. There is no guarantee that investment objectives can be achieved. Indexes are unmanaged, and investors cannot directly invest in an index. Indexed to 100. Replacement cost represented by Zurich Replacement Value Cost Trends. These cost trends are published to assist in maintaining proper levels of insurable replacement costs for commercial and industrial properties. Replacement cost refers to the estimated cost to rebuild or replace a property or asset at current market prices.
Source: Cohen & Steers, Green Street, Zurich. As of September 2025.
- Stable capital markets environment. Interest rates are projected to be relatively stable over the near to mid term. That’s important, because lower interest-rate volatility can improve investor confidence and support real estate capital markets activity. A recovery in real estate capital markets is already underway, particularly with the aforementioned growth in sales volume. For investors, this environment may create opportunities for those with dry powder (or access to capital).
- Greater lending discipline. Along with more stability in the capital markets, we are seeing greater discipline. Previous real estate recoveries often relied heavily on leverage. Now we are seeing higher-quality underwriting along with more disciplined lending standards. As a result, value appreciation may come less from artificially low interest rates or overleveraged capital structures and more from genuine growth in property income and improving market fundamentals.
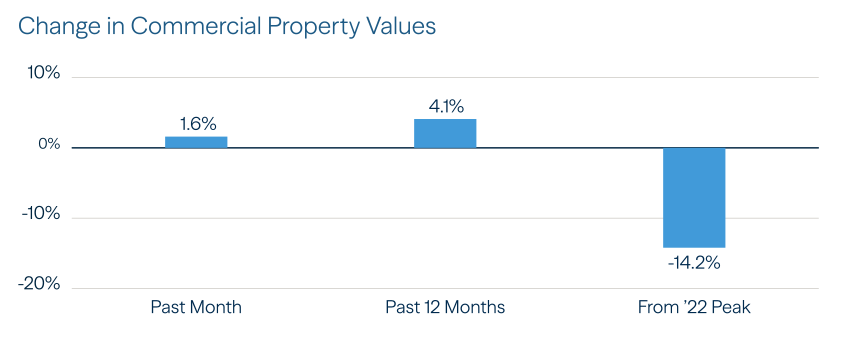
- Attractive valuations and entry yields. Despite the recent recovery, there is still room for improvement, as valuations are still 14% below their 2022 peak (see below), at a time when the cost to replace properties is much higher. In addition, entry yields are higher than they were in past cycles, providing opportunities to acquire assets that may increase in value during the hold period.
Image
Source: Green Street. As of June 4, 2026.
Headwinds That May Be Tailwinds
While private real estate faces some headwinds, these come with silver linings. Caution is still warranted with regard to the asset class, particularly in the current environment of economic and geopolitical uncertainty. But this can help reduce competition for long-term capital to acquire assets, benefiting investors.
Moreover, while real estate fundamentals are solid and improving, pockets of dislocation remain.
A large number of real estate assets are facing capital or duration pressure. According to the Mortgage Bankers Association, approximately $875 billion of commercial and multifamily mortgage debt—about 17% of all outstanding commercial mortgages—is scheduled to mature in 2026, and could be facing recapitalization at higher interest rates. This creates opportunities for General Partner–led recaps and secondaries, and could benefit investors in those vehicles.
Bottom Line
Sentiment around the asset class is actually starting to catch up with the fundamentals, we believe, with the recovery accelerating. Given the geopolitical uncertainty and continued heightened inflation, we are seeing signs of renewed interest in hard assets and investments that offer stable income. Lenders with dry powder can still make deals before the crowd is expected to fully return.
Compared with recent equity market levels, real estate may offer relative value opportunities for investors. Moreover, it may offer strong diversification benefits and potential stability and ballast in a portfolio. While a confluence of factors suggest that this is a good time to invest in real estate, it is important to be selective and choose a manager that offers skill, scale, experience and operating advantages.
Infrastructure: Emerging Tailwinds
Key Points
- The rapid growth of AI and electrification has accelerated the demand for reliable power and grid modernization. At the same time, recent geopolitical tensions in the Middle East have highlighted the importance of supply chain resilience and energy security.
- These dynamics underscore the growing need for critical energy infrastructure, as well as for the discipline and experience required to navigate constrained markets.
- Regulatory and technological constraints, not just demand, are increasingly determining where infrastructure assets can be built and scaled.
A Shifting Landscape Fueled by Strong Demand
The infrastructure investing landscape is shifting, shaped by a combination of tailwinds and headwinds. One tailwind is strong demand for power from data infrastructure—including data centers, telecom towers and fiber networks. As a result, data-related assets have become a core focus of infrastructure investing.
AI has been a significant catalyst for the growth of data infrastructure, alongside other technological developments such as cloud computing and increased mobile usage. While AI is increasing the scale and intensity of activity across data infrastructure, it is also intensifying existing power and location limitations.
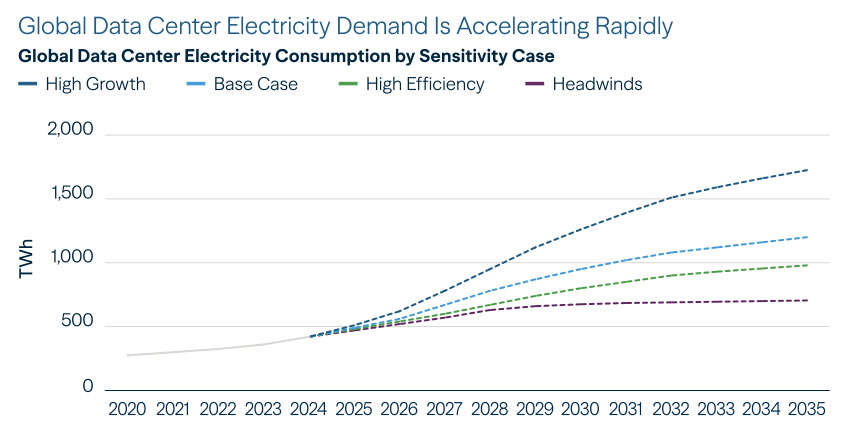
By 2030, global data center electricity demand is expected to reach nearly 1,000 terawatt-hours (TWh) under base-case scenarios, reflecting the rapid expansion of AI-driven workloads (see below). This also highlights the need to debottleneck the grid through continued investment in power generation, grid capacity and interconnection.
Image
There is no assurance that the events shown will occur, and actual outcomes may be significantly different than those shown here. These numbers serve as exploratory scenarios to inform technology and policy choices. It is crucial to consider the wide range of uncertainties, including the scale of AI adoption and the efficiency with which this additional service demand will be met.
High Growth: This case explores the impact of stronger AI adoption and increased global demand for digital services. Base Case: Despite the strong increase in growth, data center electricity demand growth is expected to account for less than 10% of global electricity demand growth between 2024 and 2030. High Efficiency: In this case, we assume that AI and digital services demand follows the same trajectory as in the base case. However, several efficiency strategies have been implemented to counterbalance the increased energy demand resulting from the higher adoption of digital technologies. Headwinds: In this case, service demand does not grow as fast as in other scenarios, and AI sees a slower uptake.
Source: International Energy Agency (IEA), Energy and AI: World Energy Outlook Special Report, April 2025.
This electricity demand is driven primarily by AI workloads that fall into two broad categories (see below):
- Model training: Model training is the process of teaching a machine learning model to recognize patterns and identify relationships by exposing it to large datasets.8 This requires significant computing power and must be located in areas with sufficient energy availability.
- Real-time inference: Inference is the process in which a trained AI model generates new outputs by reasoning and making predictions based on new data.9 It requires low latency, meaning infrastructure must be located close to end users.
Image
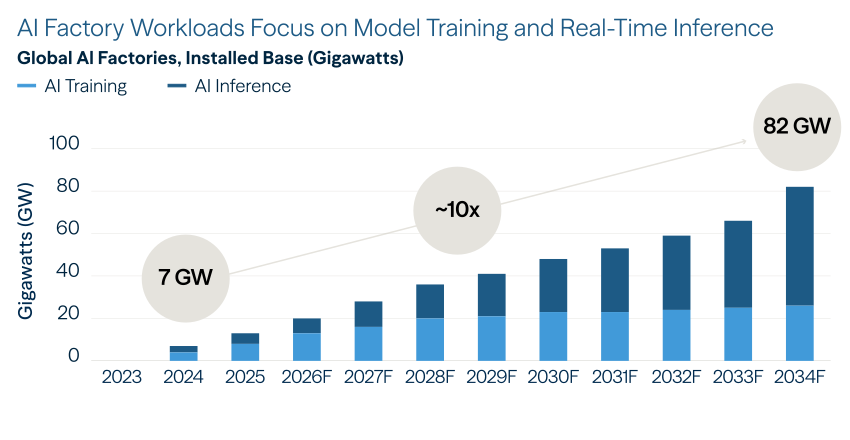
Past performance is not a reliable indicator or guarantee of future results. There is no assurance that the events shown will occur, and actual outcomes may be significantly different than those shown here. A gigawatt is a unit of electric power equal to one billion watts. AI factories are large digital hubs that feature high-performance computing power, specialized hardware such as graphics processing units (GPUs), enormous storage capacity and cooling systems that all work together to train and deploy AI models.
Source: Brookfield. As of August 2025.
These workload types help to highlight a broader dynamic: while strong demand is driving the need for new capacity, it does not necessarily determine where or how quickly that capacity can be delivered. Outcomes may increasingly depend on distinct power, location and connectivity requirements, underscoring the idea that constraints—not just demand—are becoming a defining factor in the development of data infrastructure.
Constraints and Obstacles
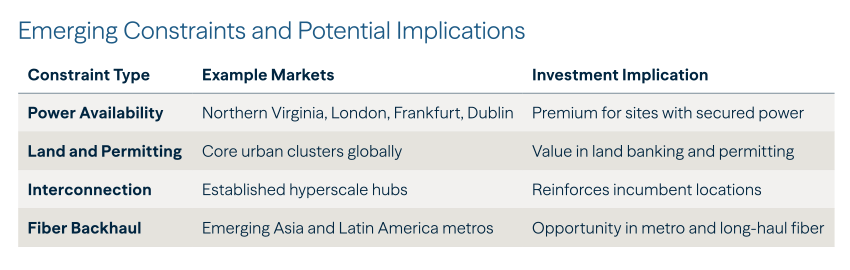
Data infrastructure operates as an integrated system, with performance primarily depending on access to power, location and network connectivity. Constraints in any one of those areas can limit the ability to deliver capacity, even when demand is strong.
AI workloads help illustrate this dynamic. Some of the power needed to drive AI can be located far from end users in large-scale campuses with abundant power. However, much of the demand remains tied to smaller facilities near end users. This creates a potential constraint: the ability to deliver power in the right place, at the right time. The workload requirements also serve as examples of headwinds for the growth and development of data infrastructure.
Potential constraints are not limited to AI. The ongoing expansion of mobile broadband coverage requires infrastructure to be able to handle increased data usage. Even with this demand, land permitting and interconnection constraints can lengthen infrastructure development timelines, while regulatory processes and labor shortages can delay projects and disrupt schedules.
Interestingly, obstacles vary across regions, reflecting their different stages of digital maturity (see below). In some markets, the priority is to continue to expand basic coverage. In others, rapid adoption is driving network densification and increasing demand for fiber and interconnection. More developed and highly penetrated markets are increasingly constrained by limits on power, land and network capacity.
Image
Source: Brookfield. For illustrative purposes only.
Still, across all environments, we see a consistent underlying pattern: The ability to deliver infrastructure is shaped less by demand and more by the ability to overcome or remove structural constraints that can limit where infrastructure can be delivered, developed and expanded over time.
The Impact of Constraints
With the speed of AI advancement, infrastructure constraints have had several impacts across the value chain.10 For example, hyperscalers are prioritizing industrial equipment suppliers that can offer reliability, products that can meet specific technical and operational requirements, and punctual delivery. For their part, suppliers are shifting their operating models to focus on execution readiness and the ability to co-engineer products. Data center customers are favoring more modular, integrated equipment for power, cooling and control systems.
Key stakeholders across the AI value chain are becoming more selective about their inputs and long-term partners. In this environment, we believe that the investors that have the necessary capital, sourcing advantages and operating expertise may be better positioned to navigate power, connectivity and location constraints.
Bottom Line
In our view, data infrastructure offers a significant opportunity for investors, but it will take skill and expertise to access these opportunities. The next phase of data infrastructure investing will be defined not by who builds the most, but by who can consistently identify, secure and execute on the most constrained opportunities.
For investors, that will require access to scarce resources, such as power, land and interconnection, combined with business models that may offer revenue visibility and the ability to expand over time. And investors should seek partners who have global sourcing and origination channels across the infrastructure value chain, access to capital and the expertise to execute across a range of market environments.
Private Equity: A Selective Recovery Takes Shape
Key Points
- Private equity activity is improving, but the recovery remains selective.
- The current outlook is shaped by the following three key factors:
- A large backlog of unsold companies that may support future transaction activity.
- Improving deal and exit activity, although the rebound remains concentrated.
- The AI boom and advanced manufacturing, which are expanding the opportunity set in parts of the physical economy.
A Selective Recovery
Private equity is entering a more nuanced phase: Activity is improving, but the recovery remains selective. In short, for investors, the key question is not simply whether private equity is back.
It is what kind of private equity exposure they own. The current outlook is shaped by three main factors:
- The large backlog of unsold companies, which is creating pressure on transactions.
- The AI boom and advanced manufacturing, which are expanding the opportunity set into parts of the physical economy.
- Improving deal activity, although the need for selectivity remains. We believe that it is essential to partner with managers who can navigate these elements through their skill, selectivity and experience improving businesses.
A Backlog Waiting to Move
Private equity is often described in financial terms, but the basic model is straightforward: buy businesses, improve them and eventually sell them. Over the past few years, that last step has proven difficult.
Higher interest rates have increased financing costs. Buyers have become more selective. Sellers have often been slow to adjust to lower valuations. Exit markets remain uneven.
That has created a large backlog of businesses that are ready to be sold. Private equity funds are holding an estimated 32,000 unsold companies worth $3.8 trillion, while distributions to investors as a share of net asset value have remained below 15% for four consecutive years.11
Image

This backlog is a challenge, but it is also a source of potential future activity. Sponsors need to return capital to investors and deploy new capital. Buyers have dry powder to facilitate deals. And many companies have been held long enough for owners to be increasingly motivated to find a path to liquidity.
The market does not need perfect conditions to improve. It simply needs enough stability for pricing expectations to reset and for buyers and sellers to agree on value. If that happens, the same backlog that has weighed on the industry could help fuel the next wave of private equity transactions.
For investors, the opportunity is not simply more deal volume. It is the potential for a more disciplined transaction environment, where capital is deployed into businesses with clearer cash flows, more realistic valuations and a greater need for operational improvement.
While Deal Activity Is Improving, the Need for Selectivity Remains
Despite continued pressure from the backlog of PE-owned companies awaiting an exit, there are signs that transaction markets are beginning to improve. Global buyout deal value rose 44% in 2025 to $904 billion, while global buyout-backed exit value increased 47%, to $717 billion.12
But this rebound has not been broad-based. Large transactions have dominated the dealmaking landscape, while activity below the megadeal level has remained uneven. For example, there were 13 megadeals of more than $10 billion that accounted for $274 billion, or roughly 30% of global buyout value (see below).
The rebound is meaningful, but it remains concentrated in the largest transactions.
In this kind of market, quality matters. Businesses with durable cash flows, clearer financing paths and identifiable operating improvements may be more likely to transact. Assets that still rely on the old playbook of cheap leverage and rising multiples may take longer to move.
That is why manager selection remains important. Private equity outcomes can vary widely by manager. Results reflect the quality of the businesses acquired, the price paid, the capital structure used and the operational improvements delivered after acquisition.
Image
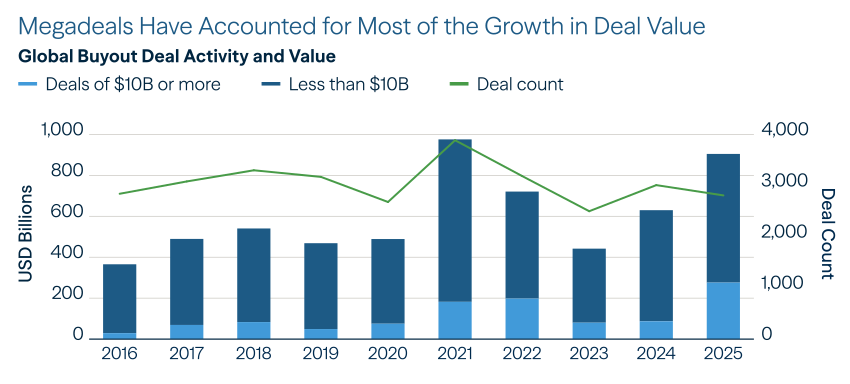
Source: Bain & Company, Global Private Equity Report 2026. As of February 22, 2026.
2024 values are estimated from reported year-over-year growth rates.
AI Is Powering the Fourth Industrial Revolution
AI is often discussed as a software story. But every industrial revolution has needed a physical backbone. Steam power required factories and railroads. Mass production required assembly lines. The computing era required semiconductors and networks.
Today’s AI era needs chips, power, cooling and automation, which all require advanced manufacturing and specialized services. AI is not only changing what software can do—it is accelerating a broader reindustrialization cycle in which physical assets and operating expertise matter again.
The data are starting to show this. U.S. industrial production for semiconductor and other electronic component manufacturing reached 188.0 in May 2026 (see below), with the index set to 2017 = 100. In plain English, output is now roughly 88% above the 2017 baseline.
Image
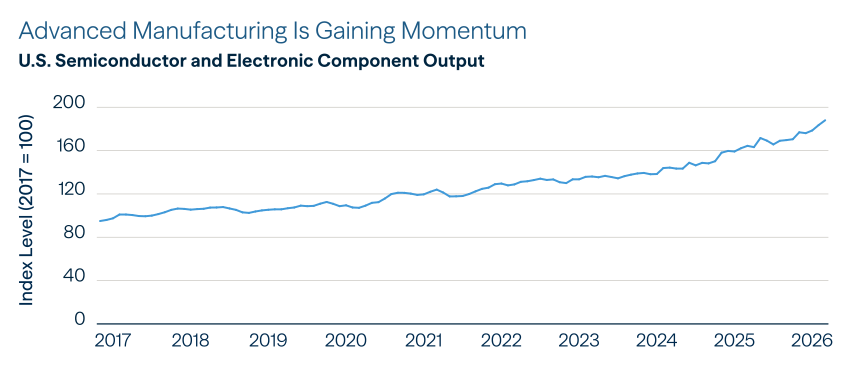
Past performance is not indicative of future results. Indexes are unmanaged, and investors cannot directly invest in an index.
Data represent Industrial Production: Manufacturing: Durable Goods: Semiconductor and Other Electronic Component (NAICS = 3344) Index. Monthly, seasonally adjusted index. 2017 = 100. May 2026 reading: 188.0105.
Source: Federal Reserve Bank of St. Louis. As of May 2026.
Of course, AI alone did not cause this increase. But it does show that advanced manufacturing and electronics are becoming a larger part of the economic story.
For private equity, the opportunity is not simply to invest behind the word “AI.” The opportunity is to own and improve the businesses that help make the Fourth Industrial Revolution possible: component manufacturers, automation providers, industrial services, logistics networks, power systems and mission-critical equipment.
This represents a long-term trend. These are the companies where value is created in the details: production planning, procurement, pricing, automation, predictive maintenance and working-capital discipline. In other words, AI may be the catalyst, but operations determine the outcome—and selectivity still matters.
Bottom Line
Private equity is entering a more selective cycle. Higher financing costs are placing greater emphasis on business improvement as a source of returns, while the Fourth Industrial Revolution is expanding opportunities across U.S. industrials, advanced manufacturing and mission-critical services.
For investors, the next cycle may favor managers that can buy well, own durable businesses and improve how those businesses operate. The goal is not simply to access private markets. It is to own what comes next—and invest wisely.
Private Credit: Headwinds Today, Tailwinds Tomorrow?
Key Points
- Private credit’s recent corporate direct lending headlines reflect real challenges. But rather than being evidence of a broken market, we believe these headwinds may reveal the characteristics of a healthy reset in a more mature market.
- Today’s headwinds may create tomorrow’s tailwinds. Muted deal activity may help restore lender discipline, repricing may improve forward economics for new capital and borrower stress may increase manager differentiation, distinguishing those that have maintained discipline from those that have relied too heavily on benign market conditions.
- The next phase may reward the same traits that have long made corporate direct lending attractive: contractual income, seniority in the capital stack vs. equities, structure and risk-mitigation potential. Direct lending may also reward managers that have the flexibility to invest across a broader range of private credit strategies.
Introduction: A Private Credit Reset
Private credit has entered a new and more nuanced phase. After more than a decade of rapid growth, the corporate direct lending market is now facing greater scrutiny with regard to underwriting, valuations, liquidity, sector exposure and borrower health.
These concerns are valid, yet we believe they are more likely to be signs of a maturing market than a broken one. While we do not think the current environment necessarily represents a full credit cycle, we do believe the market is being tested. That test reveals dispersion across borrowers, sectors and structures, and between managers with disciplined underwriting and those that may have relied too heavily on benign market conditions.
We believe some of private credit’s current headwinds may become tailwinds, such as better pricing, stronger structures, more disciplined deployment of capital, greater manager differentiation and a renewed focus on private credit strategies beyond corporate direct lending. Whether that comes to fruition will depend on how the credit cycle evolves, as well as managers’ ability to source opportunities, underwrite rigorously and maintain the discipline to say “no”—especially as private credit’s less headline-grabbing attributes, including contractual income, covenants, collateral, seniority and patient capital, become even more valuable.
Headwinds and Potential Tailwinds to Watch
Headwind: Muted deal activity. The private credit market has noticeably cooled down in recent months. U.S. direct lending volume declined 10% in 2025, while deal count was down roughly 16%.13 That represents a real decline, yet activity remains above pre-2024 levels. The greater decline in deal count vs. volume also suggests that the market is seeing fewer but larger deals as lenders and borrowers become more selective.
Potential tailwind. Slower deal activity may increase the importance of deployment discipline, but lower supply does not automatically lead to better terms or better deals. In a more selective market, disciplined lenders can wait for better risk-adjusted opportunities rather than compete aggressively for every deal. At the same time, limited supply can create more competition among lenders looking at the same higher-quality borrowers, potentially pressuring spreads. There are early signs that newer deal activity may be reflecting a higher-quality mix of borrowers, as interest coverage ratios averaged 2.5x in the second quarter of 2026, up from 2.3x in the first quarter, marking the highest level observed since the third quarter of 202214 (see below). Managers with patience and readily available capital may be positioned to originate higher-quality vintages.
Image
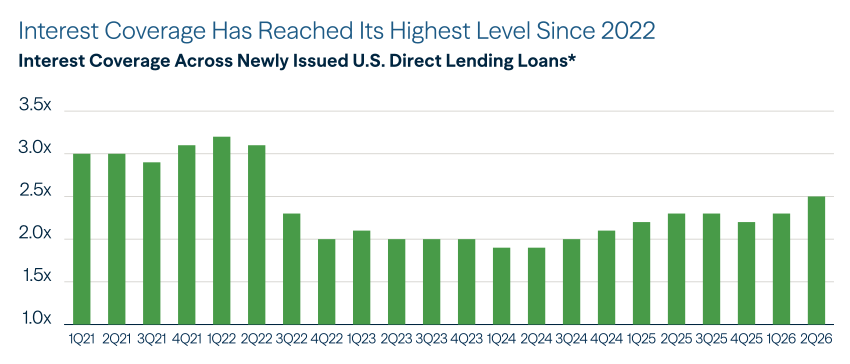
Interest coverage ratio measures a borrower’s ability to meet interest payment obligations and is generally calculated by dividing earnings by interest expense. Higher ratios generally indicate greater ability to service debt obligations.
* Excludes annual recurring revenue (ARR) deals.
Source: KBRA DLD Research. As of June 30, 2026.
Headwind: Repricing and valuation pressure. As investors reassess risk across credit markets, private credit valuations have come under pressure. Loans made during the more accommodative part of the rate and credit cycle may now face lower marks as managers reappraise credit risk, borrower performance and the assumptions that supported earlier valuations. At the same time, corporate direct lending spreads have compressed from historically wide levels, reducing the spread premium vs. liquid credit. This has put greater focus on whether investors are being adequately compensated for risk.
Potential tailwind. Repricing can create opportunities because it often reflects changing risk appetite and may improve forward economics for new capital. Even after spread compression, corporate direct lending spreads exceeded broadly syndicated loan spreads by roughly 150 basis points (bps) on average over the last 12 months (see below). But private credit’s value proposition may also come from structure, covenants, collateral, seniority and the ability to tailor solutions for borrowers in ways that are not always available in public markets. In a less accommodative deployment environment, private credit may be less about pursuing incremental yield and more about earning appropriate compensation for illiquidity, complexity and credit risk through disciplined underwriting, credit selection and risk mitigation.
Image
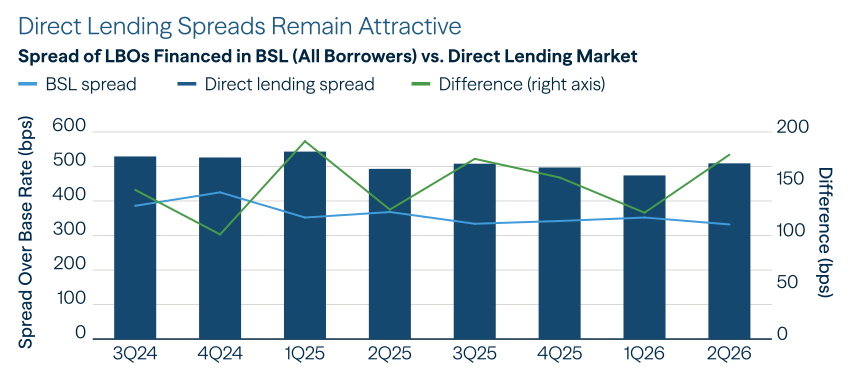
Past performance is not indicative of future results. Direct lending spread data reflect senior secured first-lien loans and unitranche facilities. A unitranche facility is typically a single tranche term loan with a blend of senior and junior tiers of debt tranches. Broadly syndicated loan (BSL) data reflects loans issued to all leveraged borrowers. Leveraged buyout (LBO) is an acquisition of a portfolio company utilizing high levels of debt. Leverage levels can be as high as 90%, with the remainder funded by equity. In an LBO, assets of the portfolio company are often used as debt collateral to support the acquisition.
A basis point is a unit of measure equal to 1/100th of one percentage point. For example, 100 basis points equals 1.00%.
Source: PitchBook LCD. As of June 30, 2026.
Headwind: Borrower stress. While overall credit markets may appear relatively calm, we think there is borrower stress beneath the surface. Higher rates, elevated leverage levels and looser underwriting standards have pressured certain borrowers, particularly those with capital structures created during the lower-rate part of the cycle. As refinancing needs approach, weaker credits may face greater pressure—including certain pre-2022 software loans built for a lower-rate, higher-valuation environment; ARR-based15 loans; and over-levered structures.
For example, software has historically been viewed as an attractive area for private credit because many businesses had recurring revenue, sticky customer bases and stable cash flows. But the combination of higher rates, elevated leverage and AI-related disruption has changed the underwriting equation. Not all software businesses face the same risks: companies with durable customer relationships, high switching costs, mission-critical products and realistic refinancing paths may look very different from those that relied heavily on elevated valuation multiples or aggressive capital structures. That distinction reinforces broader dispersion and underscores the idea that credit selection is imperative.
Potential tailwind: Borrower stress can create potential opportunities, and not simply because stress exists. Rather, a more difficult environment may help the market distinguish risk more clearly, increasing manager differentiation and reinforcing the importance of underwriting, credit selection and manager selection. More disciplined managers may be better positioned to identify stronger borrowers, avoid credit losses and preserve value.
Stress and dislocation may also create opportunities. When selling becomes more indiscriminate, managers with available capital may be able to buy selectively at more attractive prices. If stress becomes more pronounced, it may also create rescue lending opportunities.
At the same time, private credit is evolving beyond traditional corporate direct lending. Not all private credit is created equal, and investors that have corporate direct lending allocations may benefit from exposure to other areas of the private credit market. Asset-backed finance (ABF), for example, can provide exposure to contractual cash-flowing assets across sectors that may be less correlated to traditional corporate balance sheet repayment risk.
Did you know?
ABF-focused closed-end funds represented 16.4% of closed-end private credit fundraising in 2025, up from 10.6% in 2024.16 This suggests that investors are already looking beyond corporate direct lending for additional ways to diversify their private credit exposure.
Bottom Line
Today’s corporate direct lending headwinds are real, but they do not tell the entire private credit story.
Slower deal activity may restore lender discipline. Repricing may improve forward economics for new capital. And while borrower stress may increase manager differentiation, it may also create opportunities for prepared managers with capital, underwriting discipline, cycle experience and the flexibility to invest across a broader range of credit strategies.
These trends may sound less exciting than the rapid growth story that had defined private credit in recent years. Yet the power of stable income, seniority, structural protections and risk-mitigation potential can be easily overlooked when markets are calm and capital is abundant. As today’s headwinds test the market, those same attributes may help drive tomorrow’s tailwinds.
Read More in our Alts Quarterly Q3 2026.
END NOTES
1. Nasdaq, June 30, 2026.
2. Vicky Ge Huang, “Why Wall Street Bulls Aren’t Worried About Sky-High Stock Prices,” Wall Street Journal, June 29, 2026.
3. Diversification does not ensure a profit or protect against loss.
4. Preqin, “Real Estate Q2 2026: Preqin Quarterly Update,” July 31, 2026.
5. Preqin, “Infrastructure Q2 2026: Preqin Quarterly Update,” July 31, 2026.
6. PEFOX, “Secondaries Market Update – Q2 2026,” June 8, 2026.
7. Avison Young, as of March 31, 2026.
8. Kyle Aubrey, “What’s the Difference Between Deep Learning Training and Inference?” NVIDIA blog, July 29, 2016. Updated October 2025.
9. Aubrey, “What’s the Difference Between Deep Learning Training and Inference?”
10. Maria Goodpaster et al., “The $7 Trillion Data Center Buildout: How Industrials Can Capture Their Share,” McKinsey & Company, March 27, 2026.
11. Bain & Company, Global Private Equity Report 2026, February 22, 2026.
12. Bain & Company, Global Private Equity Report 2026.
13. Kazimi et al., Private Credit in 2025.
14. Interest coverage across newly issued U.S. direct lending loans; annual recurring revenue (ARR) deals excluded. KBRA DLD Research, June 30, 2026.
15. ARR loans are typically tied to negative or low EBITDA companies. These businesses tend to be more sensitive to shifts in growth expectations and cash-flow durability, particularly during periods of technological disruption. ARR is a measure of the predictable annualized revenue generated from recurring customer contracts or subscriptions.
16. Kazimi et al., Private Credit in 2025.
A WORD ABOUT RISK
As an asset class, private credit comprises a large variety of different debt instruments. While each has its own risk and return profile, private credit assets generally have increased risk of default, due to their typical opportunistic focus on companies with limited funding options, in comparison with their public equivalents. Because private credit usually involves lending to below-investment-grade or non-rated issuers, yield on private credit assets is increased in return for taking on increased risk.
Investments in real estate-related instruments may be affected by economic, legal or environmental factors that affect property values, rents or occupancies of real estate.
Infrastructure companies may be subject to a variety of factors that may adversely affect their business, including high interest costs, high leverage, regulation costs, economic slowdowns, surplus capacity, increased competition, lack of fuel availability and energy conservation policies.
Alternative investments often are speculative and include a high degree of risk. Investors could lose all or a substantial amount of their investment. High-yield bonds are subject to interest-rate risk. When interest rates rise, bond prices fall; generally, the longer a bond’s maturity, the more sensitive it is to this risk. Yields are subject to change with economic conditions. Yield is only one factor that should be considered when making an investment decision.
Investment opportunities related to artificial intelligence and emerging technologies involve significant risks including rapid technological change, regulatory uncertainty, market speculation, and the possibility that anticipated technological advances may not materialize as expected. AI-focused investments may be highly volatile and speculative in nature. Forecasts regarding AI adoption, data center demand, electricity consumption, and related infrastructure development are inherently uncertain and may not develop as anticipated.
The information in this publication is not and is not intended as investment advice, an indication of trading intent or holdings, or a prediction of investment performance. Diversification does not guarantee a profit or protect against loss. The views and information expressed herein are subject to change at any time. Brookfield disclaims any responsibility to update such views and/or information. This information is deemed to be from reliable sources; however, Brookfield does not warrant its completeness or accuracy.
The opinions expressed herein are the current opinions of Brookfield, including its subsidiaries and affiliates, and are subject to change without notice. Brookfield, including its subsidiaries and affiliates, assumes no responsibility to update such information or to notify clients of any changes. Any outlooks, forecasts or portfolio weightings presented herein are as of the date appearing on this material only and are also subject to change without notice. Past performance is not indicative of future performance, and the value of investments and the income derived from those investments can fluctuate.
Forward-Looking Statements
The information herein contains, includes or is based on forward-looking statements within the meaning of the federal securities laws, specifically Section 21E of the Securities Exchange Act of 1934, as amended, and Canadian securities laws. Forward-looking statements include all statements, other than statements of historical fact, that address future activities, events or developments, including, without limitation, business or investment strategy or measures to implement strategy, competitive strengths, goals, expansion and growth of our business, plans, prospects and references to our future success. You can identify these statements by the fact that they do not relate strictly to historical or current facts.
Words such as “anticipate,” “estimate,” “expect,” “project,” “intend,” “plan,” “believe” and other similar words are intended to identify these forward-looking statements. Forward-looking statements can be affected by inaccurate assumptions or by known or unknown risks and uncertainties. Many such factors will be important in determining our actual future results or outcomes. Consequently, no forward-looking statement can be guaranteed.
Our actual results or outcomes may vary materially. Given these uncertainties, you should not place undue reliance on these forward-looking statements. They are not intended to provide an overview of the terms applicable to any products sponsored by Brookfield Corporation and its affiliates (together, “Brookfield”). Information and views are subject to change without notice. Some of the information provided herein has been prepared based on Brookfield’s internal research, and certain information is based on various assumptions made by Brookfield, any of which may prove to be incorrect. Brookfield may not have verified (and disclaims any obligation to verify) the accuracy or completeness of any information included herein, including information that has been provided by third parties, and you cannot rely on Brookfield as having verified any of the information. The information provided herein reflects Brookfield’s perspectives and beliefs as of the date of this commentary.
Index Provider Disclaimer
The quoted indexes within this publication are unmanaged and cannot be purchased directly by investors. Index performance is shown for illustrative purposes only and does not predict or depict the performance of any investment. There may be material factors relevant to any such comparison, such as differences in volatility and also regulatory and legal restrictions between the indexes shown and any investment in a Brookfield strategy, composite or fund. Brookfield obtained all index data from third-party index sponsors and believes the data to be accurate; however, Brookfield makes no representation regarding its accuracy.
Brookfield does not own or participate in the construction or day-to-day management of the indexes referenced in this document.
The index information provided is for your information only and does not imply or predict that a Brookfield product will achieve similar results. This information is subject to change without notice. The indexes referenced in this document do not reflect any fees, expenses, sales charges or taxes. It is not possible to invest directly in an index. The index sponsors permit use of their indexes and related data on an “as is” basis, make no warranties regarding the same, do not guarantee the suitability, quality, accuracy, timeliness and/or completeness of their index or any data included in, related to or derived from it, and assume no liability in connection with the use of the foregoing. The index sponsors have no liability for any direct, indirect, special, incidental, punitive, consequential or other damages (including loss of profits). The index sponsors do not sponsor, endorse or recommend Brookfield or any of its products or services. Unless otherwise noted, all indexes are total-return indexes.
Key Terms and Index Definitions
Annualized Net Return is the geometric mean of the returns with respect to one year. It represents periodic returns rescaled to a period of one year.
Bloomberg Global Aggregate Index is a market-capitalization-weighted index comprising globally traded investment-grade bonds. The index includes government securities, mortgage-backed securities, asset-backed securities and corporate securities to simulate the universe of bonds in the market. The maturities of the bonds in the index are more than one year.
Bloomberg U.S. Corporate High Yield Bond Index measures the USD-denominated, high yield, fixed-rate corporate bond market.
Capitalization Rate (Cap Rate) is a real estate return metric used to estimate a property’s value based on its income potential. It is calculated by dividing the property’s net operating income by the present-day value of the property as indicated by prevailing market rates.
Cliffwater Direct Lending Index (CDLI) seeks to measure the unlevered, gross-of-fee performance of U.S. middle-market corporate loans, as represented by the asset-weighted performance of the underlying assets of business development companies (BDCs), including both exchange-traded and unlisted BDCs, subject to certain eligibility requirements.
Direct Lending Yield is represented by current yield, calculated as the most recent quarter’s interest payments divided by average assets over the quarter.
Dry Powder refers to committed but uninvested capital that private fund managers have available for future investment opportunities.
Enterprise Value to Earnings Before Interest, Taxes, Depreciation and Amortization (EV/EBITDA) is a valuation metric that compares a company’s total enterprise value to its EBITDA and is commonly used to assess relative valuation across companies and transactions.
FTSE EPRA Nareit Developed Real Estate Index is an unmanaged market-capitalization-weighted total-return index that consists of publicly traded equity REITs and listed property companies from developed markets.
Green Street Commercial Property Price Index (CPPI) is a time-series index published by Green Street, which tracks the value of U.S. commercial real estate properties. The index is based on transaction prices and appraisals of institutional-quality properties across major sectors, including office, industrial, retail and multifamily. It is widely used as a benchmark for changes in commercial property values over time.
ICE BofA U.S. High Yield Index tracks the performance of USD-denominated below-investment-grade corporate debt publicly issued in the U.S. domestic market.
Industrial Production: Manufacturing: Durable Goods: Semiconductor and Other Electronic Component Index measures the real output of all relevant establishments located in the United States, regardless of their ownership, but not those located in U.S. territories. The Federal Reserve’s monthly index of industrial production and the related capacity indexes and capacity utilization rates cover manufacturing, mining, and electric and gas utilities.
MSCI World Index is a free-float-adjusted market-capitalization-weighted index that is designed to measure the equity market performance of developed markets.
NCREIF Property Index (NPI) is a quarterly, unleveraged composite total return for private commercial real estate properties held for investment purposes only. All properties in the NPI have been acquired, at least in part, on behalf of tax-exempt institutional investors and held in a fiduciary environment.
Net Asset Value (NAV): The per share value of a mutual fund, found by subtracting the fund’s liabilities from its assets and dividing by the number of shares outstanding.
NFI-ODCE Index is an index of investment returns (gross of fees) of the largest private real estate funds pursuing a core investment strategy, which is typically characterized by low risk, low leverage (less than 40%), and stable properties diversified across the U.S.
Preqin Infrastructure Index captures in an index the return earned by investors on average in their private infrastructure portfolios, based on the actual amount of money invested in private capital partnerships. Each data point is individually calculated from the pool of closed-end funds for which comprehensive performance data is held, as of both the start and end of the quarter.
Preqin Private Equity Index captures in an index the return earned by investors on average in their private equity portfolios, based on the actual amount of money invested in private capital partnerships. Each data point is individually calculated from the pool of closed-end funds for which comprehensive performance data is held, as of both the start and end of the quarter.
Preqin Real Estate Index captures in an index the return earned by investors on average in their private real estate portfolios, based on the actual amount of money invested in private capital partnerships. Each data point is individually calculated from the pool of closed-end funds for which comprehensive performance data is held, as of both the start and end of the quarter.
Recapitalization is the process of changing the mix of debt and equity in an investment’s capital structure to optimize financing. In private equity, this may involve exchanging debt for equity or vice versa, such as selling shares to pay down debt. In real estate, recapitalization often means bringing in new investors to adjust the debt-equity balance. The main goals are to improve financial structure, manage debt, restructure ownership, or enhance underperforming assets.
Secondary Pricing refers to the price at which existing interests in private funds are bought and sold in the secondary market, often expressed as a percentage of the underlying fund’s net asset value (NAV).
S&P 500 Index is a market-cap-weighted equity index of 500 widely held, large-capitalization U.S. companies.
© 2026 Brookfield
BPW979628
